Web console overview
Qosifire web servicegives you full picture over your streams performance.
Here's an overview of Qosifire web console which you can see once you sign up and log into the service.
Also, learn more aboutGetting started with Qosifire to see how you can begin using it.
The main dashboard is shown below.
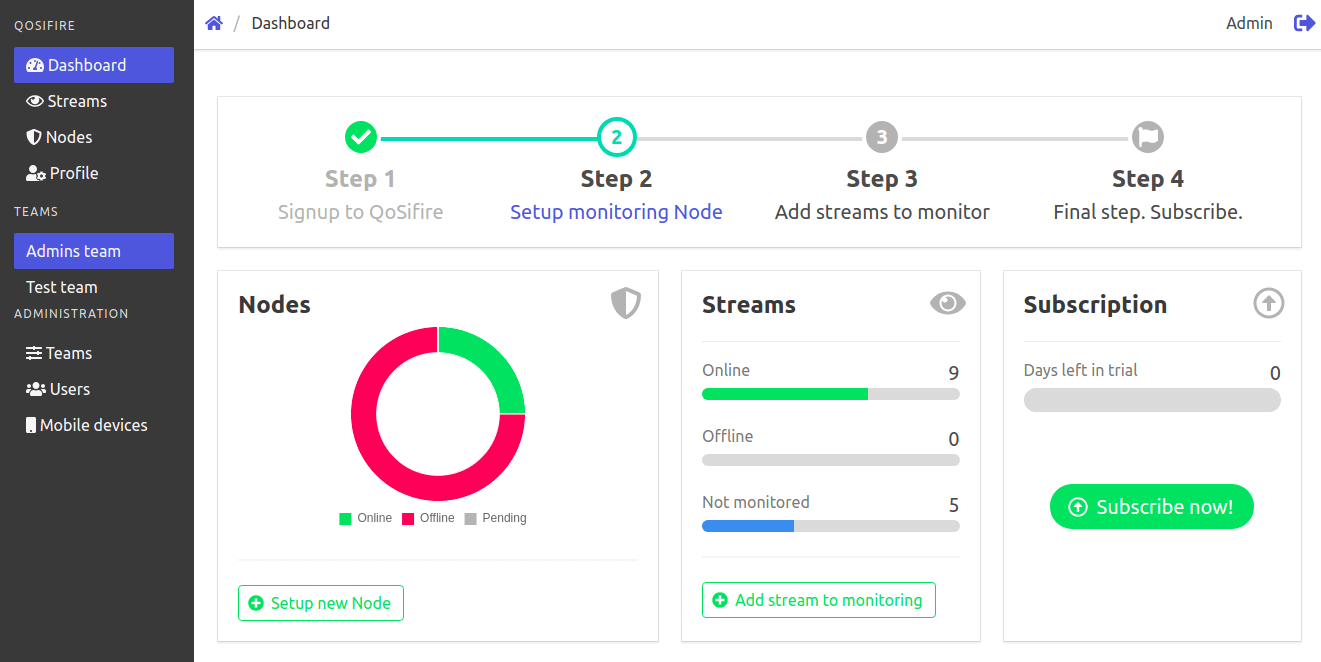
Main screen has anavigation panel and asummary area.
If you are on Qosifirefree trial, you'll see a list of steps which guides you through the setup process. Clicking on the items will bring you to appropriate pages to set up.
Summary area
The summary area below those steps shows general stats for Nodes, Streams and status of Subscription.
- Nodes tab shows overall number of nodes online, offline and pending further registration.
- Streams tab show how many streams are online, offline and put on hold for monitoring.
- Subscription tab show status of your trial period.
Navigation menu panel
The navigation menu gives access to all existing features of the monitoring console. Each menu section has several items for certain tasks.
Qosifire main menu
This is the menu you use for daily work.
- Dashboard menu switches you to the main dashboard screen you see above.
- Streams menu shows you list of currently tracked live streams, seeStreams setup and usage article for more details. Learn mode aboutstreams management in this article.
- Nodes menu brings you to nodes list page, see Nodes setup article for details.Learn more.
- Profile page shows your account details.Learn more.
Teams menu
This is the menu which you use for switching between separate teams. See the nextAdministration menu section to find out more details about setup. To learn more about teams and their usage, checkUsing teams andManaging teams articles.
Administration menu
Here you can control the following items:
- Teams menu allows creating different teams to control access.Read this article for more details.
- Users menu allows setting up users.Read this article for more details.
- Mobile devices menu allows controlling user mobile devices which receive alerts from the system.
To learn more about each section and feature please refer to corresponding links and related section of our knowledge base.